Aim
Data on warm groundwater in Vojvodina exists, but it is scattered across studies, atlases and databases, and nobody has put it into a picture that a municipality, an investor or an engineer can open and read. This project gathers it and turns it into a 3D model of Vojvodina that shows where the water is warm and at what depth.
It starts in Vojvodina because only there is public well data good enough for a model. For the rest of Serbia, a separate model will be made for each region where data turns up.
Vojvodina lies in the Pannonian Basin, where the crust is thin, 25.5 to 29 km, and the heat flow is 83 to 111 mW/m² against about 60 mW/m² for the continent on average. The average geothermal gradient is about 53 °C per kilometre of depth, where about 30 °C per kilometre is usual for continental crust. The resource is explored but little used: by 2009, 24 systems had been built, 12 were running that year, and about 8 % of the available heat power of the explored wells, 72.6 MWt, was used. The sources of these figures are in the Sources section.
3D model
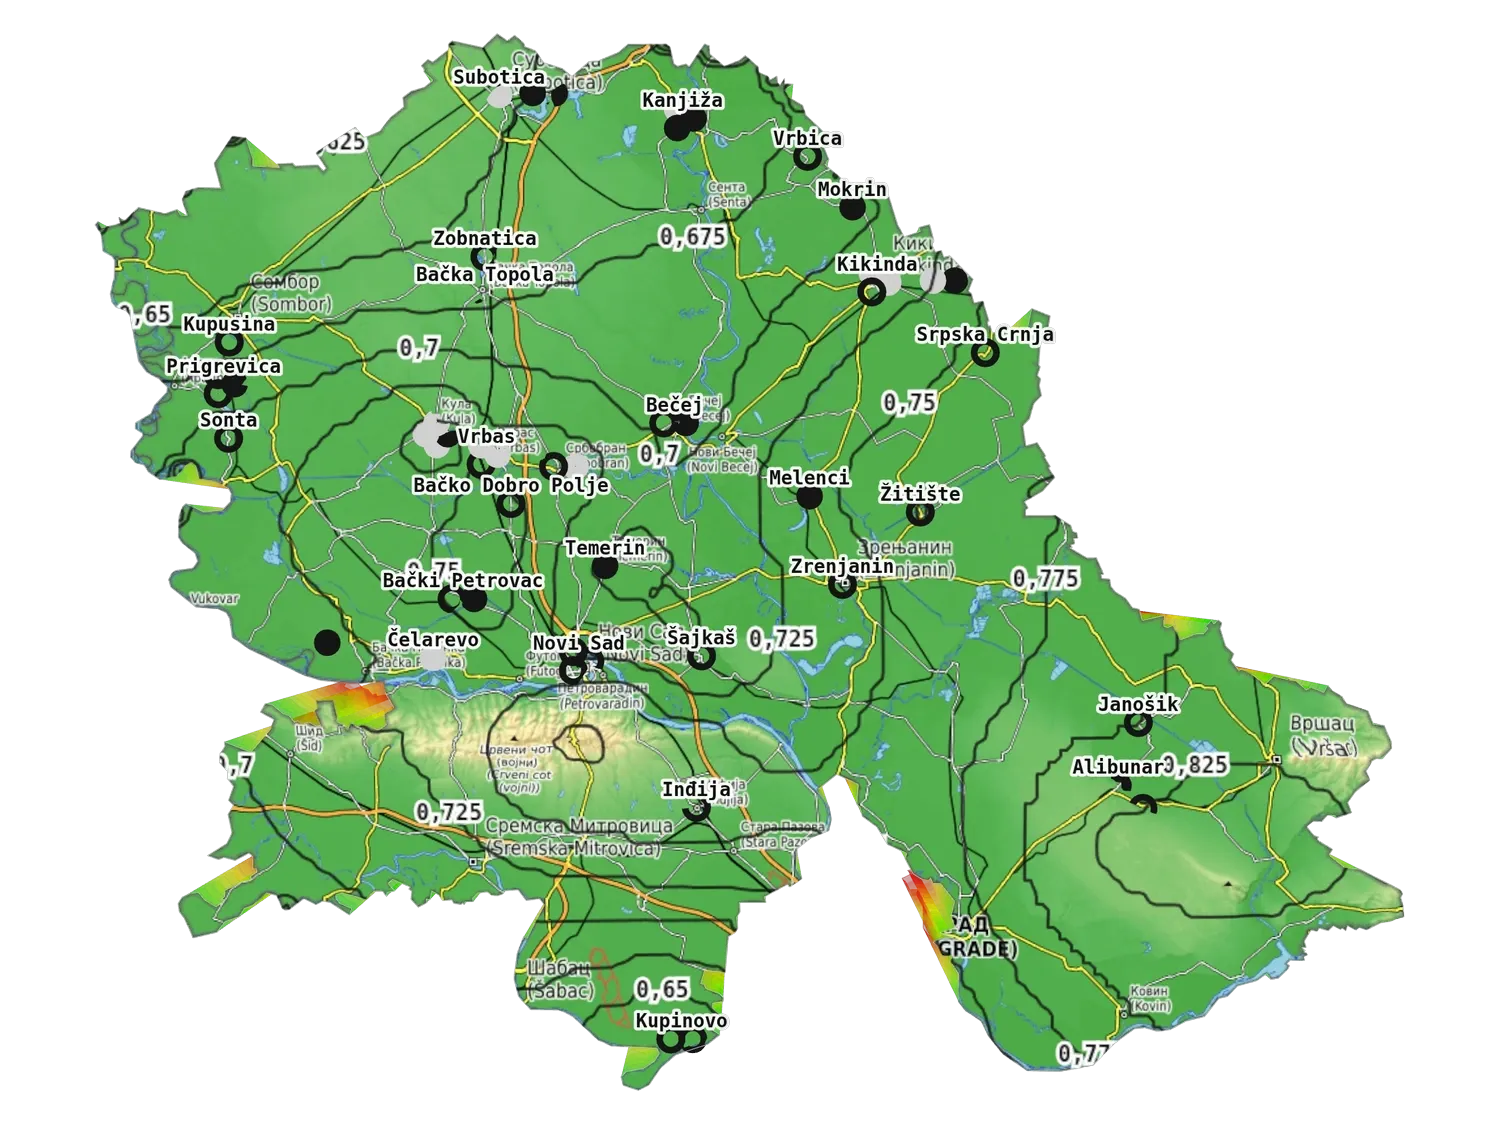
The first result of the project is the finished 3D model of Vojvodina with all 51 wells of Annex 1. The block has the shape of the province. The ground, with its relief and map, is on top; below it are translucent horizontal layers coloured by temperature, green where it is cool, through yellow, to red where it is hot. The temperatures in the layers come from the maps of the Geothermal Atlas of Vojvodina (2010) at 500, 1,000 and 2,000 m, which were digitised for this model. Each well shows its tested interval as a bar coloured by the water temperature in Annex 1. On the ground, contours show the depth at which a chosen temperature is reached; seen from above they close into rings around the warmer parts. Drag to turn the model, use the sliders for the layer spacing, opacity and the contour temperature, and click a well for its data.
Loading the 3D model…
Drag to rotate · right-drag or two fingers to pan · click the model, then scroll to zoom · click a well for details
Map data © OpenStreetMap contributors, SRTM · style © OpenTopoMap (CC-BY-SA)
Point on the ground
Print the frame
Temperature, °C
- Coloured bar on a well: measured at the tested interval
- Hollow marker: no interval given, plotted at total depth
- Coloured layers and walls: temperature from the atlas maps at 500, 1,000 and 2,000 m; a line every 10 °C on the walls
- Lines on the ground: depth in km at which the chosen temperature is reached; rings close around the warmer wells
- Wellhead: filled in production, grey idle, ring never in production
How to read it
- Position. The annex lists settlements, not coordinates, so each well stands at the centre of its settlement. Wells of one settlement are spread on a ring about 2 km wide so that they can be told apart.
- Measured. Each coloured bar is the temperature of the water at the tested interval. Where the annex gives no interval the marker is hollow and sits at the total depth; the temperature there is that of the water, which can have come from higher up, so the gradient at those wells is a lower bound.
- Atlas. The layers, walls and contours are not measured at the wells. They come from the temperature maps at 500, 1,000 and 2,000 m of the Geothermal Atlas of Vojvodina (2010), digitised from the colour classes of the maps (steps of 0.5, 1 and 2 °C). Between the maps temperature rises in straight lines from 11 °C at the surface, which is assumed. Below 2 km, deeper than any map, it continues at the slope between 1 and 2 km. The bars on the wells (annex) and the colours (atlas) are different sources and do not always agree: the atlas is warmer than the annex water at 44 of 53 tests, by 9 °C on average.
- Shape and relief. The outline is the boundary of AP Vojvodina from OpenStreetMap. The height of the ground is from Terrain Tiles on AWS (SRTM and other sources), on a 1 km grid, drawn above the median level of the province, 79 m, with the exaggeration set in the scale panel. The temperature layers are drawn as depth below that level and do not follow the ground; the difference matters only on Fruška Gora and the Vršac Mountains. The annex gives no elevations of the wells, so the wellheads sit on the ground model.
- Source. Wells and tests are from Prilog 1 of Mogućnosti korišćenja energetskog potencijala geotermalnih voda u AP Vojvodini (2005), published openly by the Provincial Secretariat for Energy and Mineral Resources: 51 wells in three tables, Kž-2/H counted once.
Data
The model uses Annex 1 of the study Mogućnosti korišćenja energetskog potencijala geotermalnih voda u AP Vojvodini (2005). The study and both annexes are published openly on the Provincial Secretariat’s website, and all data in the model comes from the openly published documents listed under Sources. The annex lists 51 wells in 32 settlements in three tables: 14 in production, 12 out of production and 25 that were never in production and are considered promising. For each it gives the settlement, year, total depth, screened interval, water temperature, yield and mineralisation.
Wells
51
Hottest
82 °C
Deepest
2,520 m
Settlements
32
- Water temperatures run from 23 to 82 °C, about 47 °C on average. The hottest are Vbc-1/H at Vrbica (82 °C, interval 1,743 to 1,854 m), Cr-5 at Srpska Crnja (75 °C), Kps-1/H at Kupusina (72 °C) and Kž-3/H at Kanjiža (70 °C). Three wells are below 30 °C, 25 are between 30 and 50 °C, 19 between 50 and 70 °C, and four are at 70 °C or more.
- Depths run from 300 to 2,520 m, about 940 m on average.
- Gradient per well, counted from 11 °C at the surface, runs from 22 to 81 °C per kilometre, with a median of 45 °C per kilometre. For the 26 wells that have a screened interval the median is 49 °C per kilometre.
- Interval: 26 of the 51 wells have a screened interval. For the other 25 the annex gives only the total depth, so the temperature is placed at the bottom of the well in the model; such a gradient is a lower bound.
The temperatures in the layers are from the Geothermal Atlas of Vojvodina (2010). Maps 5, 6 and 7 give the temperature at 500, 1,000 and 2,000 m in classes of 0.5, 1 and 2 °C. They were digitised: each pixel takes the temperature of the legend class nearest to its colour, and the result is a 2 km grid in Gauss–Krüger coordinates, with 6,421 cells, of which the model uses those inside the outline of the province. Between the maps temperature rises in straight lines from 11 °C at the surface, and below 2,000 m it continues at the slope between 1,000 and 2,000 m. The digitising agrees with the atlas: the mean temperature at 500 m is 38.3 °C against 38.2 °C in the atlas text, the highest temperatures at 500 m are around Subotica and Kupinovo and the lowest in the eastern Banat near Uljma, and the lowest temperature at 2,000 m is around Inđija, below 96 °C. The range at 1,000 m is 57.5 to 72.5 °C against 57.5 to 73.5 °C in the atlas, because a filter removes single cells.
The shape of the model is the boundary of AP Vojvodina from OpenStreetMap (© OpenStreetMap contributors, ODbL), simplified to 250 m. The relief is from Terrain Tiles on AWS (elevation from SRTM and other sources, list), on a 1 km grid, with zero at the median height of the province, 79 m. The highest point on the grid is Fruška Gora, 501 m; its summit Crveni Čot is 539 m.
Check
The atlas and the wells are two sources and do not always agree. For the 53 tests of Annex 1 (51 wells, one with three intervals) the water temperature in the annex was compared with the atlas temperature at the same depth below the same settlement.
| Tests | Count | Atlas warmer than the water | Mean difference |
|---|---|---|---|
| All | 53 | 44 | +9.0 °C, median +6.4 °C |
| With a screened interval | 28 | 21 | +5.8 °C, median +3.4 °C |
| No interval, at total depth | 25 | 23 | +12.6 °C, median +8.2 °C |
The atlas is almost always warmer, for two reasons. The annex gives the temperature of the water as it leaves the well, which is lower than the rock temperature, while the atlas corrects the temperatures measured in the wells. For the 25 tests without an interval the water temperature is placed at total depth, but the water may have come from higher up, so the comparison with the atlas at that depth is too harsh. For tests with an interval the difference is smaller, and for 14 of 28 it is within 5 °C.
So the bars on the wells and the colours of the layers should not be expected to match: the bars are the water temperature from the annex, the colours are the rock temperature from the atlas.
Sources
What was used and what could still be used.
| Theme | Source | What it holds | Access and status |
|---|---|---|---|
| Wells, used in the model | Annex 1, Mogućnosti korišćenja energetskog potencijala geotermalnih voda u AP Vojvodini (2005) | 51 wells: depth, interval, temperature, yield, mineralisation | Openly available PDF on the Provincial Secretariat’s website, entered in the model. No coordinates |
| Wells, temperature at 500, 1,000 and 2,000 m (in the model), gradient, heat flow | Geothermal Atlas of Vojvodina (2010) | 78 wells with depth, temperature, flow and heat power; ten maps at 1:300,000; a database of over 120 indicators per well | PDF with scanned maps. Maps 5, 6 and 7 were digitised into the model (2 km grid). The atlas says the database is on the Provincial Secretariat’s site; not yet obtained |
| Vojvodina in brief | GeoERA, T. Petrović Pantić (2018) | Crustal thickness, heat flow 83 to 111 mW/m², about 80 wells, highest temperature 82 °C, average 44 °C | Web page, used for context |
| Heat flow | Global Heat Flow Database, release 2024 (IHFC, GFZ Potsdam) | 91,182 heat-flow values from 1,586 publications, with quality scores | Open download via the DOI. Points in Vojvodina and licence to be checked |
| Heat flow, temperature at depth, Europe | Atlas of Geothermal Resources in Europe (Hurter & Haenel, EUR 17811, 2002) | European maps of heat flow and temperature at depth | Published PDF. Whether Serbia is covered is not confirmed |
| Springs and wells of all Serbia | Database of Serbian geothermal resources, Environmental Earth Sciences, 2021 | 293 records at 160 locations, groundwater 20 to 111 °C, three potential areas: Pannonian Basin (Vojvodina), Mačva–Srem, Jošanička Banja to Vranjska Banja | Paper. According to the paper, the data are available from the authors on request |
| Southern Serbia | Hidrogeotermalni resursi srpskog kristalastog jezgra | Thermal waters of the crystalline core: Prolom, Ribarska, Sijarinska, Vranjska and Bujanovačka Banja | Open in the national repository |
| Geology | EGDI, EuroGeoSurveys | More than 800 map layers and documents from European geological surveys | Open portal. Serbian layers not yet checked |
| National atlas | Geothermal Atlas of the Republic of Serbia, Ministry of Mining and Energy | Planned: resources by area and depth, current use, potential for heat and electricity | Tender announced in August 2026, bids due 11 September. Not published |
| Shape of the province | Boundary of AP Vojvodina, OpenStreetMap | The boundary, simplified to 250 m | Open data (ODbL), downloaded once through the Nominatim API and entered in the model |
| Relief | Terrain Tiles on AWS | Ground elevation (SRTM and other sources, list), zoom 8 | Open data, downloaded once and entered as a 1 km grid |
Settlement positions are from Wikidata, and Bačko Karađorđevo from Wikipedia (Karađorđevo, Bačka Palanka). The terrain map is OpenTopoMap, with OpenStreetMap and SRTM data, under CC-BY-SA.
Limits
- Position: the annex lists settlements, not coordinates, so each well stands at the centre of its settlement.
- Resolution of the atlas: the maps are in classes of 0.5, 1 and 2 °C, so the values are class midpoints. Between the maps temperature rises in straight lines, and below 2,000 m, deeper than any map, it is extrapolated.
- Relief: the heights are on a 1 km grid from SRTM and other sources, so peaks are lowered (Fruška Gora 501 m against 539 m). The temperature layers are drawn as depth below the median level of the province and do not follow the ground; the difference matters only on the mountains.
- A study from public data: it does not estimate a bankable resource and does not replace drilling, testing or a feasibility study for a site. It shows where those would be worth doing first.
Next steps
- The other 27 wells. Table 1 of the atlas lists 78 wells; the model has 51.
- True positions. Map 1 of the atlas gives each well’s position in Gauss–Krüger coordinates, the same ones the temperature maps were digitised in; ask the Secretariat for the database or digitise the map.
- Gradient and heat flow. Add Maps 8 and 9 of the atlas as further layers.
- Heat power and demand. Add the heat power of the wells and the towns with district heating.
- Other regions of Serbia. A separate model for southern Serbia (Vranjska Banja to Jošanička Banja) and for Mačva and Srem, once data is obtained from the authors of the 2021 paper or from the national atlas.
- Comparison with the national atlas when it is published.
Status
October 2026: the 3D model of Vojvodina is finished, in the shape of the province and with relief on the ground. The layers and contours use the digitised temperature maps of the 2010 atlas, with the wells of Annex 1 shown beside them. Adding the remaining wells and true positions is under way.