Opens the print dialog: choose “Save as PDF”. The page prints as a report with the tables and the temperature chart.
Goal
This project is a case study. Using one place as the example, it answers three questions about geothermal energy in Vojvodina: how much heat can be had there, what production from a well would look like, and how the heat would be used, starting with the spa.
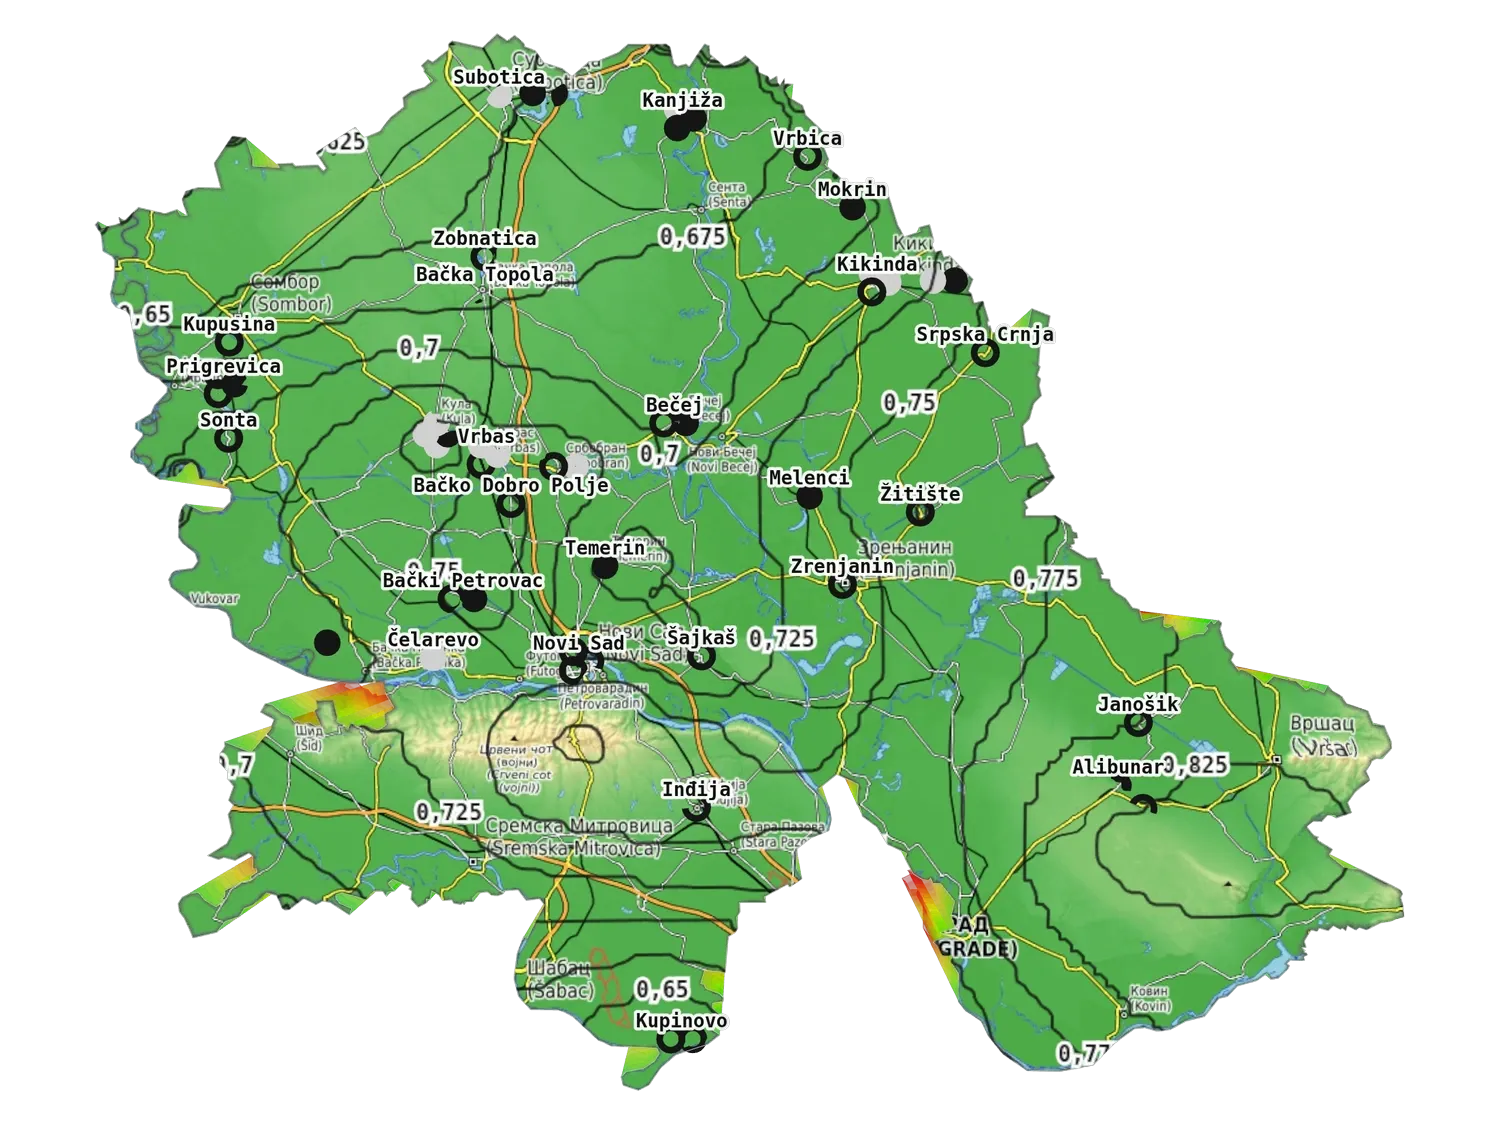
The example is Melenci in the Banat, near Zrenjanin. There is a spa, there is a well in production (Me-1/H), and public data on it exist in two documents, so the calculation can be checked. The other wells of Vojvodina are shown in the 3D model; here the same method is worked through for one place, so that it can be carried over to any other.
This is not a drilling project or a feasibility study. It shows the order of magnitude of thermal power, yearly energy and the investment that energy can carry, from public data and stated assumptions. Every assumption is marked and can be changed in the calculator at the end of the page.
Water
33 °C
Flow (Annex 1)
6.9 l/s
Thermal power
0.38 MWt
Interval
445–560 m
Starting point
Melenci is a village in the municipality of Zrenjanin, at about 45.51° north and 20.32° east, at an elevation of about 78 m. It is known as a spa town. What the spa’s present system looks like, how many wells run and what the heat is used for is not in the public documents we use, so the model starts only from what has been published.
Published data on the well Me-1/H, from Annex 1 and from the Geothermal Atlas of Vojvodina (2010):
| Item | Value | Source |
|---|---|---|
| Year drilled | 1978 | Annex 1 (2005) |
| Status | in production | Annex 1 (2005) |
| Total depth | 1,300 m | Annex 1 (2005) |
| Screened interval | 445.2 to 560 m | Annex 1 (2005) |
| Water temperature | 33 °C | Annex 1 (2005); Atlas, table 1 (2010) |
| Yield | 6.9 l/s | Annex 1 (2005); used in the calculation |
| Yield in the atlas | 10.3 l/s | Atlas, table 1 (2010); shown as an alternative |
| Mineralisation | 2.5 g/l | Annex 1 (2005) |
| Thermal power | 0.375 MWt | Computed from 6.9 l/s and 33 °C |
| Thermal power in the atlas | 0.560 MWt | Atlas, table 1 (2010) |
For the yield we use the figure from Annex 1 to the study Mogućnosti korišćenja energetskog potencijala geotermalnih voda u AP Vojvodini (2005): 6.9 l/s. The atlas (Geotermalni atlas Vojvodine, Provincial Secretariat for Energy and Mineral Resources, 2010) gives 10.3 l/s for the same temperature, and its row for Melenci has no well designation and no depth. The public documents do not explain the difference. We assume one of these reasons, or a combination:
- Time of measurement. The yield of self-flowing wells falls with time, and the two documents need not come from the same year or the same test.
- Kind of figure. One number may be the optimal yield for operation and the other the highest measured in a test, or free flow against pumping.
- A different object. The atlas row has no well designation, so it may refer to another well at Melenci or to several together, while Annex 1 gives one well, Me-1/H.
- Transcription and conversion. The atlas was compiled from a database of over 120 parameters per well, so the difference may arise in transfer or in converting units.
We cannot confirm any of this from the public documents. The calculation therefore runs on the Annex 1 flow, and the atlas flow is shown as a second case, for comparison.
The atlas computes thermal power as Q = m · (T − 20) · 0.004184, with the flow in kg per 1,000 s and a reference temperature of 20 °C. With the Annex 1 flow that is 6.9 · 4.184 · (33 − 20) = 375 kW. With the atlas flow of 10.3 l/s it gives 560 kW, exactly as in its table, so the atlas evidently computes its power from its own flow.
Geological setting
Melenci lies in the Pannonian Basin, which in Vojvodina is built of three large complexes: the basement, Neogene formations up to over 3,000 m thick in places, and Quaternary sediments. The crust is thin, 25.5 to 29 km, and the heat flow is 83 to 111 mW/m², above the continental average of about 65 mW/m². According to the atlas, heat flow is lowest in the southern Banat near Uljma and highest around Subotica.
The atlas distinguishes four hydrogeothermal systems by depth. The well at Melenci, with its interval of 445 to 560 m, belongs to the first system: sediments from the surface to the base of the Upper Pontian, developed everywhere except Fruška Gora and the Vršac hills.
| System | Rocks | Well yield | Wellhead temperature | Mineralisation | Importance |
|---|---|---|---|---|---|
| First | Sands and gravels, to the base of the Upper Pontian | most often 6.7 to 13.3 l/s, up to 28.3 l/s | about 60 °C on average | 1 to 9 g/l, most often 3 to 5 | Greatest economic importance |
| Second | Lower Pontian and Pannonian sandstones | 2.5 to 5 l/s, up to 7.3 l/s | most often 50 to 65 °C | 5 to 12 g/l, up to 20 | Small |
| Third | Miocene, Paleogene, Jurassic, Cretaceous | most often 5 to 10 l/s, up to 25 l/s | up to 54 °C, most often 40 to 50 | up to 50 g/l, aggressive waters | Small |
| Fourth | Triassic limestones and dolomites, Palaeozoic | most often 8 to 17 l/s, up to 47 l/s | up to 82 °C, most often 40 to 60 | 0.5 to 50 g/l | Insufficiently explored |
The yield and mineralisation of Me-1/H (6.9 l/s, 2.5 g/l) lie within the usual values of the first system. A temperature of 33 °C is below that system’s average of about 60 °C, which is natural for a shallow interval of 445 to 560 m. According to the atlas almost all wells in Vojvodina flow by themselves, because of pressure and the gas dissolved in the water, which is mostly methane.
Resource
Ground temperature below Melenci
The atlas gives temperature at 500, 1,000 and 2,000 m. The atlas maps, digitised for the 3D model, give for Melenci:
| Depth | Rock temperature | What is there |
|---|---|---|
| 500 m | 37.3 °C | Screened interval of Me-1/H (445 to 560 m) |
| 1,000 m | 63.5 °C | Below the screened interval; not tested below the bottom of the well |
| 1,300 m | about 80 °C | Bottom of Me-1/H |
| 2,000 m | 116.9 °C | Deepest atlas map |
Temperature rises about 52.5 °C per kilometre in the first kilometre, and 63.5 °C is reached at about 930 m. The depth at which a chosen temperature is reached:
| Temperature | Depth |
|---|---|
| 50 °C | about 740 m |
| 60 °C | about 930 m |
| 80 °C | about 1,310 m |
The water temperature at the wellhead (33 °C) is lower than the rock temperature at the same depth (37.3 °C at 500 m), because the water cools as it rises. The same difference holds across Vojvodina: in the 28 tests with a known interval the atlas is warmer than the water by 5.8 °C on average (median 3.4 °C).
Neighbouring wells
For comparison, the nearest wells in the atlas:
| Well | Depth, m | Temperature, °C | Yield, l/s | Thermal power, MWt |
|---|---|---|---|---|
| Melenci, Me-1/H | 1,300 | 33.0 | 10.3 (Annex 1: 6.9) | 0.560 (Annex 1: 0.375) |
| Zrenjanin, Zr-1/H | 870 | 48.0 | 3.96 | 0.464 |
| Zrenjanin, Zr-2/H | 503 | 24.0 | 3.67 | 0.061 |
| Žitište, Ži-1/H | 1,002 | 44.0 | 3.70 | 0.372 |
| Banatski Karlovac, BK-1/H | 510 | 26.0 | 15.9 | 0.399 |
| Kikinda, Ki-4/H | 1,203 | 57.0 | 4.80 | 0.743 |
| Prigrevica spa, Pb-1/H | 702 | 53.0 | 20.5 | 2.830 |
The last well is an example of a spa with warmer water and a higher yield at a similar depth. It shows that Melenci is the cooler end of the range in Vojvodina, not the upper limit of what the province obtains from the first system.
The resource of the whole of Vojvodina
For scale: the atlas gives the total thermal power of the explored hydrogeothermal resources in 78 wells as 72,606 MWt. Potential resources to a depth of 1,200 m are estimated at 13.6 EJ, of which hydrogeothermal 3.95 EJ, and about 25 % can practically be used, that is about 1 EJ. Serbia uses about 0.63 EJ of energy a year. By 2009, 24 systems had been built; that year 12 were running, and about 23 % of their available power was used, which is about 8 % of the explored resources.
Production model
Production is what the well gives: a flow of water at some temperature. Thermal power is
Q = flow × 4.184 × (water temperature − outlet temperature)
in kW, with the flow in l/s. Yearly energy is the power multiplied by the equivalent full-load hours.
The model looks at four cases:
- Me-1/H, Annex 1 flow: the existing well, 33 °C, 6.9 l/s (Annex 1). This is the base case.
- Me-1/H, atlas flow: the same well, 33 °C, 10.3 l/s (atlas). Shown for comparison, in case the atlas figure is right.
- Deeper horizon near 1,000 m: the atlas gives 63.5 °C in the rock, so water of 55 °C at the wellhead is taken. A flow of 5 l/s is an assumption from the range of the second system (2.5 to 7.3 l/s). It is not a measurement.
- New well near 1,300 m: the atlas gives about 80 °C in the rock, so 75 °C at the wellhead and 8 l/s are taken, an assumption from the range of the fourth system (most often 8 to 17 l/s). It is not a measurement.
Cases 3 and 4 show what would be obtained if a deeper horizon gave water and a flow of the kind the atlas allows. We do not know whether that would hold at Melenci: the well was drilled to 1,300 m, but only the interval from 445 to 560 m was tested.
Utilisation model
The water is not used in one place. The model passes it through a chain of users, in order of the temperature they ask for:
- Space heating down to 35 °C, low-temperature (floor) heating;
- Pools down to 28 °C;
- Heat pump, which cools the water to 15 °C and delivers heat at 45 °C, for hot water and radiator heating.
A stage is skipped if the water is too cool for it. So a 33 °C well does not heat buildings, heats the pools only a little (33 → 28 °C), and the heat pump supplies most of the energy.
The heat pump. The coefficient of performance is computed as 0.4 of the Carnot value: COP = 0.4 · (T_out + 273.15) / (T_out − T_source). For a source of about 22 °C and an output of 45 °C that is about 5.4. The real range is 40 to 55 % of the Carnot value; the lower part is used here. The seasonal coefficient in operation is lower than this.
| Case | Water, °C | Flow, l/s | Above 20 °C (atlas), kW | Space heating, kW | Pools, kW | Heat pump, kW | Pump electricity, kW | Heat delivered, kW | Heat per year, MWh |
|---|---|---|---|---|---|---|---|---|---|
| Me-1/H, Annex 1 flow (2005) | 33 | 6.9 | 375 | 0 | 144 | 460 | 85 | 605 | 2,419 |
| Me-1/H, atlas flow (2010) | 33 | 10.3 | 560 | 0 | 215 | 687 | 127 | 903 | 3,610 |
| Deeper horizon near 1,000 m (assumed) | 55 | 5 | 732 | 418 | 146 | 334 | 62 | 898 | 3,594 |
| New well near 1,300 m (assumed) | 75 | 8 | 1,841 | 1,339 | 234 | 534 | 99 | 2,107 | 8,427 |
The chain is the same in every case: space heating down to 35 °C, pools down to 28 °C, then a heat pump takes the water down to 15 °C and delivers heat at 45 °C with a coefficient of 0.4 of the Carnot value. Heat per year is for 4,000 equivalent full-load hours. The 55 °C and 75 °C cases and their flows are assumptions, not measurements.
How to read the table. The first column of figures (Above 20 °C) is the power as the atlas computes it, for comparison. The heat delivered is larger than that, because the heat pump cools the water below 20 °C to 15 °C and because the pump’s electricity turns into heat. Part of the heat delivered (the pump’s electricity) is not geothermal.
The main points of the table:
- By the figures of Annex 1 the existing well gives 375 kW above 20 °C, and with the pump about 600 kW of heat delivered, using about 85 kW of electricity. With the atlas flow that is 560 kW, or about 900 kW.
- Water at 33 °C is not for heating without a heat pump. Its value is in bathing and in the pump.
- The deeper cases give much more per unit of flow: the 55 °C case with only 5 l/s gives about 900 kW of heat delivered, about 1.5 times the existing well at the Annex 1 flow (and as much as at the atlas flow), and the 75 °C case over 2 MW. The reason is temperature, not flow.
Phased development
We divide the development of a geothermal project into ten phases, from a preliminary survey to decommissioning, with a workover of the existing well after the survey. The phases before construction are the riskiest, because only the workover, testing and drilling confirm the resource. Adapted to a small heat system at Melenci:
| Phase | What is done at Melenci | Decision at the end |
|---|---|---|
| 1. Survey | Collect published data (this project); establish the condition of the existing well and the heat demand | Whether it makes sense to go on |
| 2. Workover of the existing well | Workover of Me-1/H: inspection of the casing and cement, cleaning of the well and screens, replacement of wellhead equipment; opening a further interval if needed | Whether the workover restores or raises the flow, and whether it justifies further investment |
| 3. Exploration | Test Me-1/H after the workover: flow, temperature, pressure, water chemistry; test by interval | How much the well that already exists gives |
| 4. Test drilling | If a deeper horizon is pursued: a new well or deepening | Whether the deeper horizon gives water and flow |
| 5. Planning | Design of the distribution, the heat pump and reinjection; permits | The financial decision |
| 6. Field development | A reinjection well, if needed | |
| 7. Construction | Pipeline, heat exchangers, heat pump | |
| 8. Commissioning | Adjustment, staff training | |
| 9. Operation | Monitoring of temperature and pressure | |
| 10. Decommissioning | Closing the wells |
Developing a geothermal project usually takes 5 to 10 years. We expect a small heat system to take less, but we have no source for that estimate.
Three working rules we apply:
- Phased development. First a small unit that gives heat at once, then expansion once the resource is confirmed. This spreads the investment and reduces the risk.
- Drilling success. We assume about 70 % of wells succeed, so more than one well should be planned for each one needed. Six successful wells need nine.
- Learning. We assume the fifth well in the same field costs no more than 80 % of the first.
Economics
The calculation compares the cost of building with the value of the heat the system gives. The cost is the sum of six items. For two of them (drilling and equipment) there is a public estimate from 2012; for four there is no public figure for Serbia, so two are taken as assumptions (the heat pump and the distribution) and two have not been assessed (the workover and the gas equipment). The table gives the basis of each figure. A seventh item, the reinjection well, is counted separately, in the table of omitted items below.
| Item | Value used | Basis |
|---|---|---|
| Drilling a new well | 400 €/m | Public estimate of 350 to 400 € per metre (blog post of 2012 without a cited source); the upper figure is used. For Vojvodina no newer public figure was found. |
| Equipment for using the heat (exchangers, pumps) | 200,000 € | Public estimate of about 200,000 € (the same 2012 post). Assumed to cover everything on the surface except the heat pump and the pipe. |
| Heat pump | 500 €/kW | Assumption. Public prices for Serbia exist only for household units (3,000 to 15,000 € installed, without the power); a unit of hundreds of kW costs less per kW, so 500 € per kW is taken. |
| Distribution pipe | 500 m × 400 €/m | Assumption: a route of 500 m at 400 € per metre. No public price per metre for Serbia was found. |
| Reinjection well | 400 €/m | Counted only in the table of omitted items: one well to the depth of the producing interval (560 m for Me-1/H), at the same drilling cost. The injection pump and its electricity are not assessed. |
| Workover of the existing well | 0 € | Not assessed, so not included. No public cost was found; an assessment of the workover is a step of its own. |
| Equipment for using the gas | 0 € | Not assessed, so not included. It would be needed only if the water holds enough gas to be worth using; the gas content of Me-1/H has to be measured first. |
Public data are scarce and old: the drilling cost of 350 to 400 € per metre comes from a blog post of 2012 with no cited source, and prices of heat pumps in Serbia are published only for household units. The workover of the existing well is not included, because there is no public price for it and the condition of the well must be assessed first. The investments for the existing well in the table are therefore lower than they will be.
The value of the heat depends on the fuel it replaces. The spa uses electricity, and may have its own central heating on electricity or on gas, so we count both:
- Gas heating. The public figure is the gas price for households, 4.08 din/kWh without taxes and levies, set by the regulator from 1 January 2023 (N1, 28 November 2022); we found no public price for business. With a boiler efficiency of about 0.9 and about 117 din to the euro that is about 40 €/MWh of heat.
- Electric heating. The public figure is the EPS offers to business: 105.77 to 109.17 €/MWh for energy, with excise and fees of about 25 €/MWh (021.rs, 20 April 2025), so about 130 €/MWh. Electric heating gives heat at an efficiency near 1, so the heat is worth the same.
Three values of heat are therefore shown: 40 (replaces gas), 85 (middle) and 130 €/MWh (replaces electricity); prices are without VAT, and the spa pays under its own contract. The same electricity price, 130 €/MWh, is used as the price of electricity for the heat pump. The real values should be entered in the calculator.
Operating costs
The yearly operating costs (OPEX) are the heat pump’s electricity, upkeep and other fixed costs.
| Case | Heat pump electricity, k€ | Upkeep, k€ | Other fixed costs, k€ | Operating costs, k€ a year |
|---|---|---|---|---|
| Me-1/H, Annex 1 flow (2005) | 44 | 19 | 10 | 73 |
| Me-1/H, atlas flow (2010) | 66 | 22 | 10 | 98 |
| Deeper horizon near 1,000 m (assumed) | 32 | 29 | 10 | 71 |
| New well near 1,300 m (assumed) | 51 | 36 | 10 | 97 |
Electricity is charged at 130 €/MWh. Upkeep is 3 % of the investment a year and other fixed costs are 10,000 € a year (monitoring, water analyses, attendance): both are assumptions with no public source. Reinjection is not counted, because it would need another new well; the cooled water is discharged. The atlas says almost all wells in Vojvodina flow by themselves, so no production pump is counted.
The largest item for the existing well is the heat pump’s electricity (44 k€ a year at 130 €/MWh), so the price of electricity decides. If the heat pump replaces cheap gas (40 €/MWh), operating costs of 73 k€ a year eat most of the revenue from the heat (97 k€), and the payback is long.
Payback
| Case | Estimated investment, M€ | Payback at 40 €/MWh, years | Payback at 85 €/MWh, years | Payback at 130 €/MWh, years |
|---|---|---|---|---|
| Me-1/H, Annex 1 flow (2005) | 0.63 range 0.44–0.95 | 26.7 net 24 k€ a year | 4.8 net 132 k€ a year | 2.6 net 241 k€ a year |
| Me-1/H, atlas flow (2010) | 0.74 range 0.52–1.12 | 16.1 net 46 k€ a year | 3.6 net 209 k€ a year | 2 net 371 k€ a year |
| Deeper horizon near 1,000 m (assumed) | 0.97 range 0.68–1.45 | 13.3 net 73 k€ a year | 4.1 net 234 k€ a year | 2.4 net 396 k€ a year |
| New well near 1,300 m (assumed) | 1.19 range 0.83–1.78 | 4.9 net 240 k€ a year | 1.9 net 619 k€ a year | 1.2 net 999 k€ a year |
Investment is the sum of the items in the cost table, without the workover and the gas equipment, which have not been assessed; the range is that of a class 4 estimate (−30 % to +50 %). Net gain is the value of the heat less the yearly operating costs in the table below. Payback is the investment divided by the net gain a year, without discounting. The gas of the water is not counted here.
From the table (operating costs are counted, the workover and the gas of the water are not):
- Existing well, Annex 1 flow: an investment of about 0.63 million € (range 0.44 to 0.95), payback of 26.7 years if the heat replaces gas (40 €/MWh), 4.8 at 85 and 2.6 if it replaces electricity (130). At the atlas flow the investment is 0.74 million € and the payback 16.1, 3.6 and 2.0 years.
- Deeper horizon (55 °C, 5 l/s, one new well to 1,000 m): about 0.97 million €, payback 13.3, 4.1 and 2.4 years. Only drilling shows whether the water is there.
- New well to 1,300 m (75 °C, 8 l/s): about 1.19 million € (range 0.83 to 1.78), payback 4.9, 1.9 and 1.2 years.
- What it means: if the heat replaces gas, the payback is long in every case (5 to 27 years); if it replaces electricity, short (1 to 3 years). The workover is added to the investment: at 85 €/MWh every 100,000 € of workover lengthens the payback of the existing well by about 0.8 years.
What the payback table leaves out
The payback table holds no reinjection well, no risk that a new well finds no water and no workover of the existing well. The table below adds them one at a time and all together, at the middle value of the heat of 85 €/MWh.
| Case | As in the payback table | With a reinjection well | With drilling risk | With a workover | All together |
|---|---|---|---|---|---|
| Me-1/H, Annex 1 flow (2005) | 4.8 investment 0.63 M€ | 6.8 investment 0.85 M€ | –does not apply | 5.6 investment 0.73 M€ | 7.8 investment 0.95 M€ |
| Me-1/H, atlas flow (2010) | 3.6 investment 0.74 M€ | 4.8 investment 0.97 M€ | –does not apply | 4.1 investment 0.84 M€ | 5.4 investment 1.07 M€ |
| Deeper horizon near 1,000 m (assumed) | 4.1 investment 0.97 M€ | 6.1 investment 1.37 M€ | 5 investment 1.14 M€ | –does not apply | 7.1 investment 1.54 M€ |
| New well near 1,300 m (assumed) | 1.9 investment 1.19 M€ | 2.8 investment 1.71 M€ | 2.3 investment 1.41 M€ | –does not apply | 3.2 investment 1.93 M€ |
The reinjection well goes to the depth of the producing interval (560 m for the existing well, the depth of the new well in the other cases) at 400 €/m; the injection pump and its electricity are not counted. Drilling risk: 70 % of wells succeed, so one successful well costs as much as 1/0.7 wells; it applies to new wells only. The workover is a round figure of 100,000 €, as there is no public price; it applies to the existing well only. Upkeep (3 % a year) is taken on the larger investment. Gas equipment is still not counted.
The reinjection well is the largest of these items: it adds about 0.22 M€ to the existing well and lengthens its payback from 4.8 to 6.8 years, and it adds 0.4 to 0.5 M€ to the new wells. With all the items together the existing well pays back in 7.8 years, near the limit, the deeper horizon of 55 °C goes from 4.1 to 7.1 years, and the new well of 75 °C stays clearly profitable at 3.2 years. At 40 €/MWh the existing well with all the items does not pay back in a reasonable time; that figure and all the others come from the calculator, in which the drilling success rate and the reinjection wells can be set.
Methane
The water holds dissolved gas, mostly methane, so there may be revenue: gas separated from the water and burned in a boiler replaces fuel that would be bought. The atlas gives 0.04 to 2.2 m³ of gas per m³ of water for the first system, and for Me-1/H itself the content is not published, so the whole range is shown.
| Gas in the water, m³ per m³ | Gas a year, m³ | Methane energy, MWh a year | Value, k€ a year | Against the heat of the existing well |
|---|---|---|---|---|
| 0.04 (lowest in Vojvodina) | 3,974 | 36 | 1.2 | 1.5 % |
| 2.20 (highest in Vojvodina) | 218,592 | 1,956 | 68.4 | 80.9 % |
Per the atlas the water of the first system holds 0.04 to 2.2 m³ of gas per m³, mostly methane (80 to 95 %); 90 % is taken. The flow is 6.9 l/s (Annex 1) over 4,000 hours a year; the energy is valued at 35 €/MWh, the price of the gas it would replace. The gas content of Me-1/H itself is not published: it has to be measured, and it decides whether the gas is worth separating and using. Gas from the water is explosive, so using it needs separation, safety measures and equipment that are not costed here.
At the low end of the range the gas is worth about 1 thousand € a year (1.5 % of the heat), which does not even cover the separation equipment. At the high end it is worth about 68 thousand € a year, or 81 % of the value of the heat of the existing well. The gas is therefore not counted in the payback table: a measurement of the gas content of Me-1/H decides. If the content is high, it changes the calculation: for the existing well at 40 €/MWh the payback falls from 27 to about 7 years, but without the separation and safety equipment, which has not been assessed. The gas can be entered in the calculator together with the equipment.
A cost estimate at this stage belongs to class 4 under AACE: an accuracy of −15 to −30 % on the low side and +20 to +50 % on the high side. The range in the table is that range, and this calculation, with still more unknowns, cannot hope for better accuracy.
Risks and sustainability
Resource. The greatest risk is that a deeper horizon gives no water or less than assumed. The second system yields only 2.5 to 5 l/s (up to 7.3).
Cooling and falling pressure. With long use the reservoir pressure falls; as a working assumption we take the life of a reservoir as 30 to 50 years. In Vojvodina production from the existing systems has fallen since 1990, from nearly 1.6 million m³ a year to 739 thousand m³ in 2009. The atlas does not separate the causes into technical and market ones.
Reinjection. Reinjection is counted neither in the payback table nor in the operating costs, because it needs another new well; the cooled water is discharged for now. The table of omitted items shows how much that well would lengthen the payback. To sustain the resource one reinjection well to two production wells would be counted. In the sandy layers of the first system reinjection is technically demanding (clogging), so this should be checked before a decision. Without reinjection, the cooled water must be disposed of in line with regulations.
Chemistry and gas. A mineralisation of about 2.5 g/l is moderate. The water contains dissolved gas, mostly methane (80 to 95 %), at 0.04 to 2.2 m³ per m³ of water, so a plant needs gas separation and explosion protection. The atlas warns of aggressiveness and scaling in the waters of the third system.
Legal framework. Using geothermal water needs permits and, for drilling, approvals from the competent bodies. This project does not work through them; they are part of phase 5.
Calculate your case
The calculator uses the same chain of users and the same formulas as the tables. Change the temperature, the flow and the assumptions; the tables on this page stay as they are.
Conclusion: when a geothermal well pays
The calculation shows that profitability does not hang on one figure but on four: the temperature of the water, the flow actually used, the fuel the heat replaces, and whether an existing well is used or a new one drilled. The tables below are for one new well, with all the assumptions of this page; the depth of the well follows the temperature of the water.
| Water, °C (well depth, m) | 3 l/s | 5 l/s | 10 l/s | 20 l/s |
|---|---|---|---|---|
| 35 (550) | – does not pay | 70.5 does not pay | 18.7 does not pay | 9.9 near the limit |
| 50 (800) | 36.6 does not pay | 15.2 does not pay | 7.1 near the limit | 4.2 clear |
| 65 (1,100) | 19.2 does not pay | 9.6 near the limit | 4.8 clear | 2.9 clear |
| 80 (1,400) | 14.1 does not pay | 7.4 near the limit | 3.8 clear | 2.3 clear |
| Water, °C (well depth, m) | 3 l/s | 5 l/s | 10 l/s | 20 l/s |
|---|---|---|---|---|
| 35 (550) | 15.3 does not pay | 8.1 near the limit | 4.3 clear | 2.7 clear |
| 50 (800) | 7.6 near the limit | 4.4 clear | 2.4 clear | 1.5 clear |
| 65 (1,100) | 5.6 near the limit | 3.3 clear | 1.8 clear | 1.1 clear |
| 80 (1,400) | 4.6 clear | 2.8 clear | 1.5 clear | 0.9 clear |
| Water, °C (well depth, m) | 3 l/s | 5 l/s | 10 l/s | 20 l/s |
|---|---|---|---|---|
| 35 (550) | 7.3 near the limit | 4.3 clear | 2.4 clear | 1.6 clear |
| 50 (800) | 4.2 clear | 2.6 clear | 1.5 clear | 0.9 clear |
| 65 (1,100) | 3.3 clear | 2 clear | 1.1 clear | 0.7 clear |
| 80 (1,400) | 2.8 clear | 1.7 clear | 0.9 clear | 0.6 clear |
Every well here is one new well drilled to the depth at which the rock is 4 °C warmer than the water (the gradient of Melenci, 52.5 °C per km), with the same prices and assumptions as above, the heat pump, 500 m of pipe and the surface equipment, with all the heat used for 4,000 hours a year. The workover, reinjection, gas and the subsidies are not counted. Clear: payback up to 5 years; near the limit: 5 to 10 years; does not pay: over 10 years. These limits are our judgement.
Reasonable payback periods. Our judgement, with no public source: a payback of up to 5 years is clearly profitable, 5 to 10 years is near the limit, and over 10 years does not pay without a subsidy or better conditions. A well and its distribution last for decades, but an investor asks for payback far sooner, and the cost estimate has an accuracy of −30 % to +50 %. A payback of 5 to 10 years is therefore within the error of the estimate and cannot be judged without a study.
Assumption. A geothermal well in Vojvodina clearly pays when the heat replaces expensive energy, or when the water is hot and the flow large. In particular:
- The heat replaces electricity (about 130 €/MWh): clearly profitable almost everywhere, with a payback of up to 5 years for every combination except the coolest and weakest (35 °C, 3 l/s: 7.3 years, near the limit).
- The heat replaces gas (about 40 €/MWh): clear only for hot water and a large flow: 65 °C or more with 10 l/s or more (2.3 to 4.8 years) and 50 °C with 20 l/s (4.2). Near the limit are 50 °C with 10 l/s (7.1), 65 °C with 5 l/s (9.6) and 80 °C with 5 l/s (7.4). A cooler or weaker well does not pay (for example 35 °C with under 20 l/s, or 65 °C with 3 l/s: 19 years).
- A middle value of the heat (85 €/MWh): clearly profitable for most combinations; near the limit for small flows (3 l/s at 50 and 65 °C, 5 l/s at 35 °C), and only 35 °C with 3 l/s does not pay.
- An average well of the first system (about 60 °C, 7 to 13 l/s by the atlas) is, at 40 €/MWh, from near the limit to clearly profitable (65 °C: 9.6 years at 5 l/s, 4.8 at 10 l/s), and at a higher value of heat clearly profitable.
- Melenci (33 °C, 7 l/s from Annex 1), the existing well with no drilling: profitable if the heat replaces electricity (2.6 years) and at 85 €/MWh (4.8), and it does not pay if it replaces gas (27 years). With a reinjection well and a workover of 100,000 € the payback at 85 €/MWh rises to 7.8 years, near the limit.
The conclusion is that Vojvodina has no single answer: a place with hot water and a strong source, whose heat replaces electricity or an expensive fuel, pays clearly; a cool, weak source replacing cheap gas does not; between them is a wide area where everything depends on costs, and that cannot be judged from public data.
What is not counted and changes the conclusion: the workover of the existing well, reinjection, the gas of the water, the real heat demand (all the heat is taken to be used for 4,000 hours a year), subsidies and financing, permits, the chemistry of the water (scaling, aggressiveness) and the risk that a new well does not give the expected water. Any of these can move the payback from one class to another; for the workover, reinjection and drilling risk the table of omitted items shows by how much.
Detailed studies can be done with a good team of specialists (geologists, drillers, thermal engineers, economists), and only they give a basis for a decision to invest. This page shows whether such a study makes sense for a given place.
Method and limitations
- Data: one well; for the yield we use the figure of Annex 1 (6.9 l/s), and the atlas gives a different one (10.3 l/s). The rest is assumption and is marked as assumption.
- Temperatures of deeper layers come from the atlas maps in classes; at 2,000 m the value is the middle of a class. They are not a measurement at Melenci.
- Heat pump: a coefficient of 0.4 of the Carnot value, with a source of about 22 °C and an output of 45 °C. The real seasonal coefficient depends on the maker and the mode of operation.
- Load: the model works with constant power and equivalent hours. We do not know the spa’s demand by hour and season.
- Prices: the value of heat (the price of gas and electricity) and the price of electricity are for other customers than the spa at Melenci; upkeep and other fixed costs are assumptions with no public source. Ranges are shown.
- Not a design: the calculation does not replace testing the well, a chemical analysis of the water, the design of the system or a feasibility study.
Sources
| Topic | Source | What it holds |
|---|---|---|
| Well Me-1/H | Annex 1 to the study Mogućnosti korišćenja energetskog potencijala geotermalnih voda u AP Vojvodini (2005) | Depth, interval, temperature, yield, mineralisation |
| Yield, power, hydrogeological systems, resources, use | Geotermalni atlas Vojvodine (Geothermal Atlas of Vojvodina), prepared within the Studija stanja i ocena resursa geotermalne energije AP Vojvodine (study of the state and assessment of geothermal energy resources of AP Vojvodina), Provincial Secretariat for Energy and Mineral Resources (2010) | Table 1 with 78 wells, four systems, resources, use to 2009 |
| Ground temperature at 500, 1,000 and 2,000 m | The same atlas, maps 5, 6 and 7, digitised in the 3D model | Temperature in classes of 0.5, 1 and 2 °C |
| Price of electricity | 021.rs, 20 Apr 2025: EPS offers to business, 105.77 to 109.17 €/MWh, with excise and fees of about 25 €/MWh | The price of electricity for the heat pump and for electric heating |
| Price of gas | N1, 28 Nov 2022: the gas price for households, 4.08 din/kWh without taxes and levies | The price of heat from a gas boiler; no public price for business was found |
| Cost of drilling and equipment | Energetska efikasnost i obnovljivi izvori energije, “Geotermalna energija Srbije”, 1 Sep 2012 | Drilling 350 to 400 € per metre, equipment for using the heat about 200,000 €; author and source not given |
| Cost of heat pumps | Vreme, 20 Jul 2026; Kurir, 23 Jul 2026 | Installed household heat pump 3,000 to 15,000 €, power not given; no price per kW for larger units was found |
| Cost estimate class | AACE International, Recommended Practice 18R-97, Cost Estimate Classification System | Classification of cost estimates by project maturity |
Thermal power is computed by the atlas formula (reference temperature 20 °C). Everything else is the method and assumptions of this page.
What is needed for a clearer picture
To get a clearer picture, it is necessary to:
- establish the difference in yield: 6.9 l/s (Annex 1) against 10.3 l/s (atlas), in the original documentation: who measured, when and what was measured;
- assess the workover of the well Me-1/H: the condition of the casing, the cement and the screens, the scope of the work and its cost. The assessment decides whether to go ahead with the workover and how much it may raise the flow; its cost is then added to the investment;
- get the condition of the spa: how many wells run, what the water is used for, the heat demand by month;
- replace assumptions with measurements (temperature and flow of a deeper horizon, if it is tested) and measure the gas content of the water of Me-1/H, because it decides whether the gas is revenue;
- replace the assumed prices with quotations: heat pump, distribution and equipment, and the cost of drilling, from contractors, because public data for Serbia are not enough.
Status
October 2026: the production and utilisation model for Melenci is done, with a calculator; the data are public and the assumptions are marked.
About this page
This page is a personal, informational piece of work, made only from the publicly released data named in the sources. The case study illustrates a method on the example of one place and does not describe the real system of the spa or its data. It uses no data, documentation or estimates of any employer or company, does not represent their views and is not an offer of services. The calculation gives an order of magnitude, not a design: a decision about a well needs a test of the well, an assessment of the workover, a measurement of the gas, the real heat demand, quotations from contractors and a detailed study by a team of specialists. See also the Terms of use.